Climate Analysis
The Maproom explores historical daily precipitation by calculating simple seasonal
statistics.
The Maproom explores historical daily temperature by calculating simple seasonal statistics.
Rainfall and temperature time series reconstructed from station observations and remote
sensing proxies. This interface allows users to view rainfall, maximum, minimum and
mean temperature dekadal climatologies and anomalies. The climatology is defined over
the period 1991 - 2020 .
Rainfall time series (1991-2020) and temperature time series (1991-2020) reconstructed
from station observations, remote sensing and other proxies. This interface allows
users to view rainfall, maximum, minimum and mean temperature monthly climatologies
and anomalies.
Rainfall time series (1991-2020) and temperature time series (1991-2020) reconstructed
from station observations, remote sensing and other proxies. This interface allows
users to view rainfall, maximum, minimum and mean temperature seasonal trends expressed
per year, over the selected period or percent of the average over the selected period.
Rainfall time series (1991-2020) and temperature time series (1991-2020) reconstructed
from station observations, remote sensing and other proxies. This interface allows
users to view rainfall, maximum, minimum and mean temperature seasonal climatologies,
anomalies and probability of exceedance.
The Maproom facilitates the exploration of the history of extreme monthly and seasonal
rainfall characteristics.
The Maproom facilitates the exploration of the history of extreme monthly and seasonal
minimum and maximum temperatures.
The Standardized Precipitation Index is an indicator of extreme rainfall events, whether
they are drought or excess rainfall.
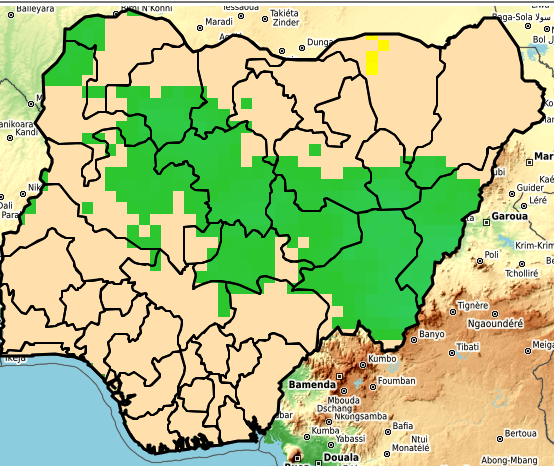
This map shows the historical probability (given in percentile) of seasonal average
monthly rainfall falling within the upper (wet), middle (normal), or bottom (dry)
one-third ("tercile") of the 1991-2020 historical distribution in Nigeria given the
state of ENSO (El Niño, Neutral, La Niña) during that same season.
This map shows the historical probability (given in percentile) of seasonal average
monthly minimum or maximum temperature falling within the upper (hot), middle (normal),
or bottom (cold) one-third ("tercile") of the 1991-2020 historical distribution in
Nigeria given the state of ENSO (El Niño, Neutral, La Niña) during that same season.
//var/parameter/(.precip)/eq/{.Rainfall}{.Temperature}ifelse/.dekadal/.c9120//var/get_parameter/interp/T/(1-10%20Sep)/VALUE//name//clim_var/def/SOURCES/.WORLDBATH/.bath/X/2.4/14.925/RANGE/Y/3.975/14.1/RANGE/1/index/SOURCES/.Features/.Political/.Nigeria/.States/.the_geom/X/Y/fig-/colors/colors/||/colors/black/thin/stroke/-fig//T/first/plotvalue//antialias/true/psdef//layers[//clim_var//States/]psdef//plotborder/0/psdef//antialias/true/psdef//plotaxislength/220/psdef/+.gif)
//var/parameter/(.precip)/eq/{.Rainfall}{.Temperature}ifelse/.monthly/.c9120//var/get_parameter/interp/T/(Oct)/VALUE//name//clim_var/def/SOURCES/.WORLDBATH/.bath/X/2.4/14.925/RANGE/Y/3.975/14.1/RANGE/1/index/SOURCES/.Features/.Political/.Nigeria/.States/.the_geom/X/Y/fig-/colors/black/thin/stroke/-fig//layers%5B//clim_var//States%5Dpsdef//antialias/true/psdef//plotborder/0/psdef//plotaxislength/220/psdef//T/first/plotvalue/+.gif)
//var/parameter/(.precip)/eq/{.Rainfall}{.Temperature}ifelse/.monthly//var/get_parameter/interp/T/(Jun)//seasonStart/parameter/(-)/append/(Aug)//seasonEnd/parameter/append/(%20)/append/(1991)//YearStart/parameter/append/(-)/append/(2020)//YearEnd/parameter/append/seasonalAverage//var/get_parameter/(.precip)/eq/%7B//seasonEnd/get_parameter/interp//seasonStart/get_parameter/interp/sub/dup/0/ge/%7B1/add%7D%7B13/add%7Difelse/mul/%7Dif/T/first/VALUE/SOURCES/.Features/.Political/.Nigeria/.States/.the_geom/X/Y/fig-/colors/black/thin/stroke/-fig//plotborder/0/psdef//antialias/true/psdef//plotaxislength/220/psdef/+.gif)
//var/parameter/(.precip)/eq/{.Rainfall}{.Temperature}ifelse/.monthly//var/get_parameter/interp/T/(Jul)//seasonStart/parameter/(-)/append/(Sep)//seasonEnd/parameter/append/(%20)/append/(1991)//YearStart/parameter/append/(-)/append/(2020)//YearEnd/parameter/append/seasonalAverage//var/get_parameter/(.precip)/eq/%7B//seasonEnd/get_parameter/interp//seasonStart/get_parameter/interp/sub/dup/0/ge/%7B1/add%7D%7B13/add%7Difelse/mul/%7Dif/T/first/VALUE/SOURCES/.Features/.Political/.Nigeria/.States/.the_geom/X/Y/fig-/colors/black/thin/stroke/-fig//plotborder/0/psdef//antialias/true/psdef//plotaxislength/220/psdef/+.gif)


//season/parameter/seasonalAverage/%5BT%5Dpercentileover/%7BDry/0.33333/Normal/0.66667/Wet%7Dclassify/SOURCES/.NOAA/.NCDC/.ERSST/.version5/.sst/zlev/removeGRID/X/-170/-120/RANGE/Y/-5/5/RANGEEDGES/a%3A/%3Aa%3A/T/(Jan%201991)/(Dec%202020)/RANGE/yearly-climatology/%3Aa/sub/%7BY/cosd%7D%5BX/Y%5Dweighted-average/T/(Aug%201949)/last/RANGE/T/3/1.0/runningAverage/%7BLaNina/-0.45/Neutral/0.45/ElNino%7Dclassify/T/-2/1/2/shiftdata/%5BT_lag%5Dsum/5/flagge/T/-2/1/2/shiftdata/%5BT_lag%5Dsum/1.0/flagge/dup/a%3A/sst/(LaNina)/VALUE/%3Aa%3A/sst/(ElNino)/VALUE/%3Aa/add/1/maskge/dataflag/1/index/2/flagge/add/sst/(phil)/unitmatrix/sst_out/(Neutral)/VALUE/mul/exch/sst/(phil2)/unitmatrix/sst_out/(LaNina)/(ElNino)/VALUES/%5Bsst_out%5Dsum/mul/add/T//season/get_parameter/VALUES/1/masklt/mul/%5BT%5Daverage/tercileclassesscale/precip//Tercile/renameGRID/sst//ENSO/renameGRID/DATA/0/1/RANGE/ENSO/(LaNina)//ensoState/parameter/VALUE/Tercile/(Dry)//tercile/parameter/VALUE//name//proba/def/SOURCES/.WORLDBATH/.bath/X/2.4/14.925/RANGE/Y/3.975/14.1/RANGE/1/index/SOURCES/.Features/.Political/.Nigeria/.States/.the_geom/X/Y/fig-/colors/colors/%7C%7C/colors/black/thin/stroke/-fig//antialias/true/psdef//plotaxislength/220/psdef//plotborder/0/psdef//color_smoothing/1/psdef//layers%5B//proba//States%5Dpsdef/+.gif)
//var/parameter/interp/T/(Jul-Sep)//season/parameter/seasonalAverage/%5BT%5Dpercentileover/%7BCold/0.33333/Normal/0.66667/Hot%7Dclassify/SOURCES/.NOAA/.NCDC/.ERSST/.version5/.sst/zlev/removeGRID/X/-170/-120/RANGE/Y/-5/5/RANGEEDGES/a%3A/%3Aa%3A/T/(Jan%201991)/(Dec%202020)/RANGE/yearly-climatology/%3Aa/sub/%7BY/cosd%7D%5BX/Y%5Dweighted-average/T/(Aug%201949)/last/RANGE/T/3/1.0/runningAverage/%7BLaNina/-0.45/Neutral/0.45/ElNino%7Dclassify/T/-2/1/2/shiftdata/%5BT_lag%5Dsum/5/flagge/T/-2/1/2/shiftdata/%5BT_lag%5Dsum/1.0/flagge/dup/a%3A/sst/(LaNina)/VALUE/%3Aa%3A/sst/(ElNino)/VALUE/%3Aa/add/1/maskge/dataflag/1/index/2/flagge/add/sst/(phil)/unitmatrix/sst_out/(Neutral)/VALUE/mul/exch/sst/(phil2)/unitmatrix/sst_out/(LaNina)/(ElNino)/VALUES/%5Bsst_out%5Dsum/mul/add/T/2/index/T/-3/shiftGRID/.T/.gridvalues/VALUES/T/3/shiftGRID/1/masklt/mul/%5BT%5Daverage/tercileclassesscale//var/get_parameter/1/5/getinterval/interp//Tercile/renameGRID/sst//ENSO/renameGRID/DATA/0/1/RANGE/ENSO/(LaNina)//ensoState/parameter/VALUE/Tercile/(Cold)//tercile/parameter/VALUE//name//proba/def/SOURCES/.WORLDBATH/.bath/X/2.4/14.925/RANGE/Y/3.975/14.1/RANGE/1/index/SOURCES/.Features/.Political/.Nigeria/.States/.the_geom/X/Y/fig-/colors/colors/%7C%7C/colors/black/thin/stroke/-fig//antialias/true/psdef//plotaxislength/220/psdef//plotborder/0/psdef//color_smoothing/1/psdef//layers%5B//proba//States%5Dpsdef/+.gif)
//monitAna/parameter/(rainfall)/eq/{.precip}if//name/(monitAna)/def/SOURCES/.WORLDBATH/.bath/X/2.4/14.925/RANGE/Y/3.975/14.1/RANGE/1/index/SOURCES/.Features/.Political/.Nigeria/.States/.the_geom/X/Y/fig-/colors/colors/||/colors/black/thin/stroke/-fig//antialias/true/psdef//T/first/plotvalue//layers%5B//monitAna//States%5Dpsdef+//plotaxislength+220+psdef//plotborder+0+psdef//color_smoothing+1+psdef+.gif)